

Written by Wes Crill, PhD
Senior Client Solutions Director and Vice President, Dimensional Fund Advisors
Historical data show that small cap, low relative price, and high profitability stocks each
have delivered a premium versus the market. Some investors ask why bother holding
anything but stocks that check all three boxes. I respond by channeling Jack Nicholson in
A Few Good Men: “You can’t handle the tracking error!”
The average returns for these stocks make a compelling case for concentrating in them.
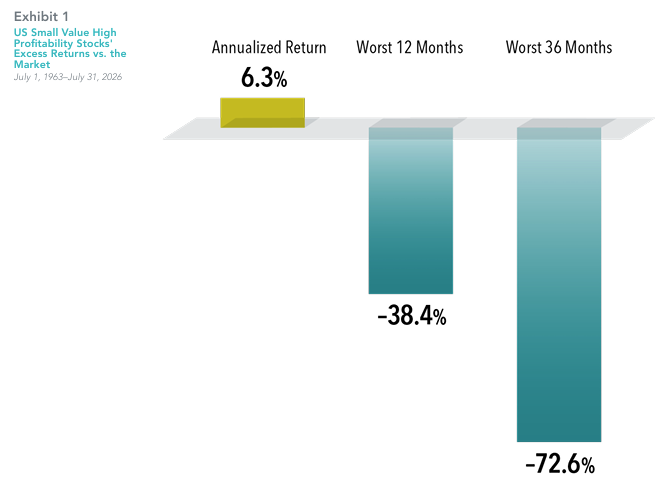
US small value high profitability stocks returned 17.1% annualized from July 1963 to July
2026, more than six percentage points greater than the broad US market at 10.9%. That’s
the difference between doubling your money about every four years instead of seven.
Before getting too excited, be aware there simply aren’t many stocks fitting this
definition. Stocks that are simultaneously small cap, low price-to-book, and high
profitability are about as common as foods that are both healthy and delicious. As such,
these stocks represent a tiny portion of the market.
The size of this group means their returns often have extreme deviations from the
market. Their annualized tracking error has been 11.8%. While tracking error is an
unintuitive statistic, this should crystallize things: At their worst, small cap value stocks
with high profitability underperformed the market by over 72 percentage points in a 36
month period.
Applying insights from research on stock returns is like cooking with spicy peppers. Few
people have the stomach for them on their own. But incorporating them as part of a
recipe can enhance a dish, just like tilting toward higher expected return stocks in a
broadly diversified asset allocation can improve outcomes for investors.
Past performance is not a guarantee of future results.
In USD. US market is the Fama/French Total US Market Research Index. US Small Value High Prof based on the 32 Portfolios formed on size, book-to-market, and operating profitability from the Ken French data library and includes stocks ranking below the NYSE median for market cap and above the NYSE median for book-to-market ratio and operating profitability. Worst relative returns are the minimum returns in excess of the market for rolling periods of 12 and 36 months. The Fama/French indices represent academic concepts that may be used in portfolio construction and are not available for direct investment or for use as a benchmark. Eugene Fama and Ken French are members of the Board of Directors of the general partner of, and provide consulting services to, Dimensional Fund Advisors LP. See “Index Descriptions” for descriptions of Fama/French index data.
The information in this material is intended for the recipient’s background information and use only. It is provided in good faith and without any warranty or representation as to accuracy or completeness. Information and opinions presented in this material have been obtained or derived from sources believed by Dimensional to be reliable, and Dimensional has reasonable grounds to believe that all factual information herein is true as at the date of this material. It does not constitute investment advice, a recommendation, or an offer of any services or products for sale and is not intended to provide a sufficient basis on which to make an investment decision. Before acting on any information in this document, you should consider whether it is appropriate for your particular circumstances and, if appropriate, seek professional advice. It is the responsibility of any persons wishing to make a purchase to inform themselves of and observe all applicable laws and regulations. Unauthorized reproduction or transmission of this material is strictly prohibited. Dimensional accepts no responsibility for loss arising from the use of the information contained herein.
This material is not directed at any person in any jurisdiction where the availability of this material is prohibited or would subject Dimensional or its products or services to any registration, licensing, or other such legal requirements within the jurisdiction.
“Dimensional” refers to the Dimensional separate but affiliated entities generally, rather than to one particular entity. These entities are Dimensional Fund Advisors LP, Dimensional Fund Advisors Ltd., Dimensional Ireland Limited, DFA Australia Limited, Dimensional Fund Advisors Canada ULC, Dimensional Fund Advisors Pte. Ltd., Dimensional Japan Ltd., and Dimensional Hong Kong Limited. Dimensional Hong Kong Limited is licensed by the Securities and Futures Commission to conduct Type 1 (dealing in securities) regulated activities only and does not provide asset management services.
RISKS
Investments involve risks. The investment return and principal value of an investment may fluctuate so that an investor’s shares, when redeemed, may be worth more or less than their original value. Past performance is not a guarantee of future results. There is no guarantee strategies will be successful.
Dimensional Fund Advisors LP is an investment advisor registered with the Securities and Exchange Commission.
Investment products: • Not FDIC Insured • Not Bank Guaranteed • May Lose Value Dimensional Fund Advisors does not have any bank affiliates.

Recent Comments